Here’s what we have for you this week.
-
Growth
🛠 Tools: Blocking trackers and Get scripts from videos.
📚 Resources: The best software on the planet, all in one place.
💡 Tip of the Week: How to use price anchoring.
Product
🛠 Tools: Generate documentation and humans.
📚 Resources: Explore product benchmarks by company stage.
💡 Tip of the Week: Explore product benchmarks by industry.
Growth.
🛠 Tools 👇
PixelBlock → Block email trackers. (free)
We’ve all been tracking emails since our 3rd edition, right?
Now let’s protect ourselves from them, you’d be surprised about how many trackers are in emails these days.
-
HappyScribe → Video to Script and Subtitles. (free trial)
One of the best in the market, with loads of languages and great accuracy.
📚 Ressources
I can’t believe how many people don’t know G2, especially in Europe.
For any software… Research, compare, read bullet-proof reviews, etc.
💡 Tip of the Week
An awesome way of using the “price anchoring” persuasion technique.
Product.
🛠 Tools 👇
Guidde → Create user documentation in no time using AI (free plan)
Capture your flow and transform it into a video and a step-by-step guide.
No extra work, but a bonus: AI-generated voiceover.
Let’s check the gallery.
So far, the easiest way of producing and maintaining clear documentation for your users.
-
Ai Human generator → As impressive as frightening, let’s generate humans! (free)
It even works with real faces.
📚 Ressources
When it comes to product metrics, we can find content about the metrics to follow or even how to build a great data stack, but finding references to put the results into context is more complicated.
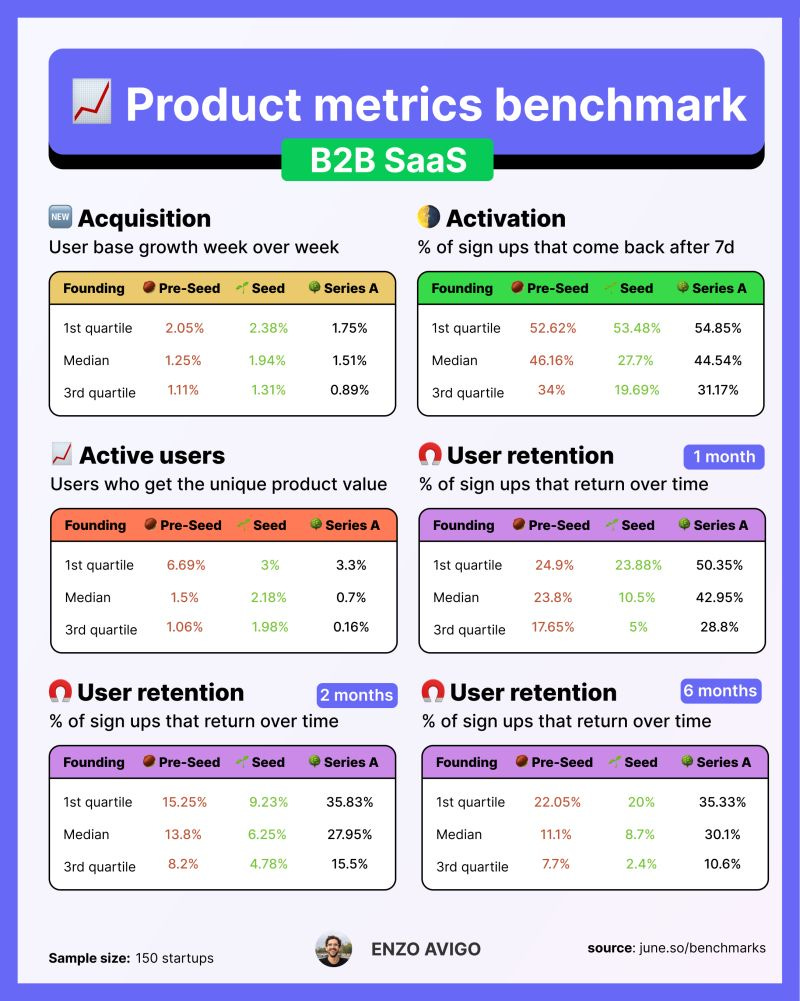
Here is a product metrics benchmark for SaaS and B2C companies made by June (a product analytics company) based on 357 companies in November 2023.
You can access the full report here.
And a quick view of B2B SaaS 👇 by Enzo Avigo
It’s really easy to use.
Let’s take an example : you want to know more about “acquisition + B2B + Pre-seed stage”.
Let’s say you had 100 users. If you have 10 new users this week, you've grown by 10% in a week.
The report shows that
1st Quartile: The top 25% of companies (those performing the best) saw at least 2.52% growth.
Median WoW Growth: The middle point of growth rates, where half of the companies grew faster and half grew slower, was 1.43%.
3rd Quartile: The bottom 25% of companies (those performing the least) saw growth rates of 1.01%.
You can access the full report here.
What can we also learn from this report?
It comes from the comparison between the three stages.
Acquisition rate decline: The gradual decline in growth rates from pre-seed to Series A is expected due to the law of large numbers.
Strategic shifts: Each funding stage reflects a shift in strategic priorities—from validating the business model to scaling the product and operations to optimizing for profitability and sustainable growth. This is why the retention rate is higher for Serie A companies, for instance.
💡 Tip of the Week
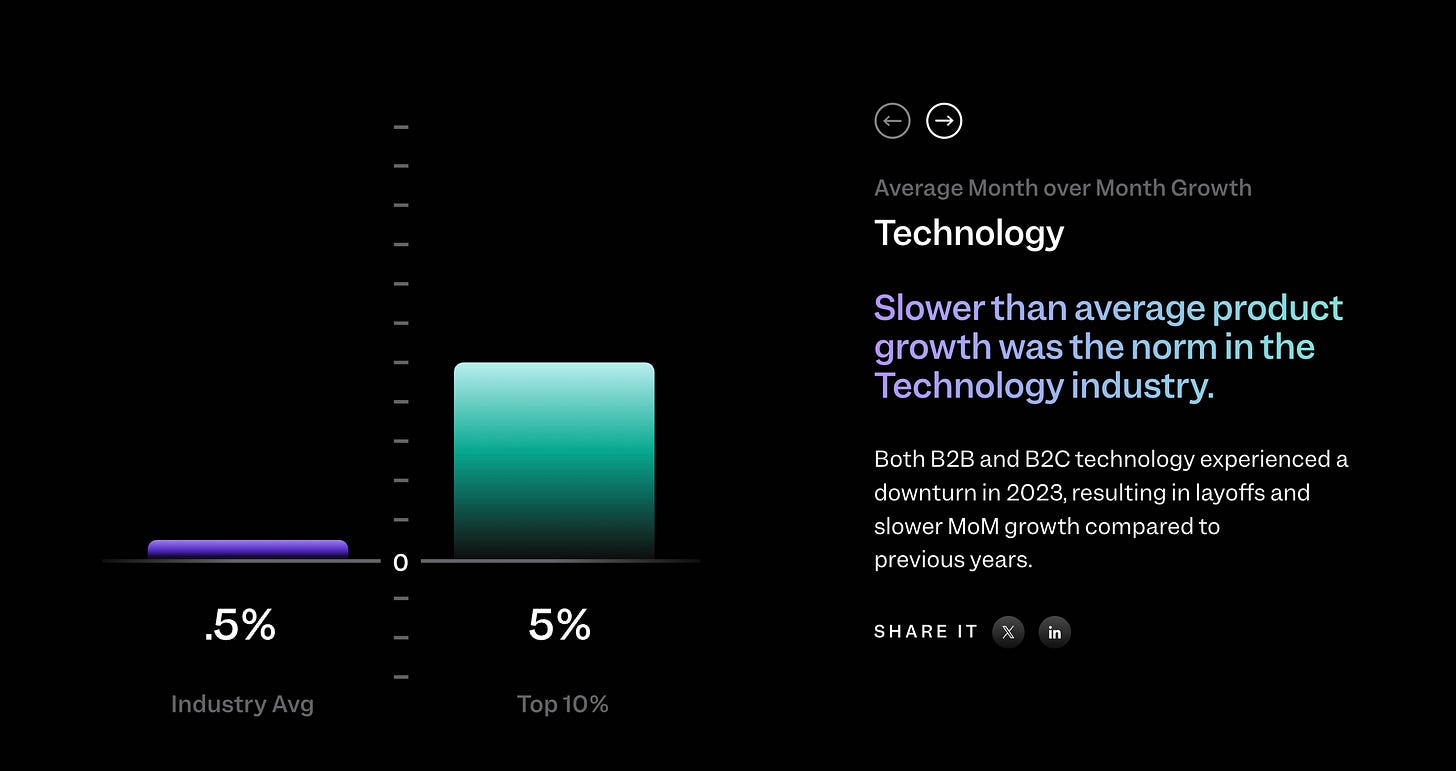
This week's best tip is the Mixpanel 2024 BENCHMARKS REPORT.
”Explore product benchmarks by industry and put your performance in perspective.”
For those who want to dig deeper!
You can download the full report here
We’ll see you next week.


